A friend of mine told me that he had just followed a great trader and had already made 20% because the price went up every time this person bought stocks. He said that this trader used a very powerful method called Chan Theory, and his technical indicators are very powerful.
“I know Chan Theory,” I said with a smile. “To be honest, that guy is probably not very skilled at trading. He made money simply because the stock market has been doing well lately.”
I told him that I had also doubled my account recently, not that I’m a genius, but that I was in the market when the trend came.
You can make money with Chan Theory, moving averages (MA), MACD, or Bollinger Bands as long as you enter a bullish market. The only difference is whether you enter earlier or later.
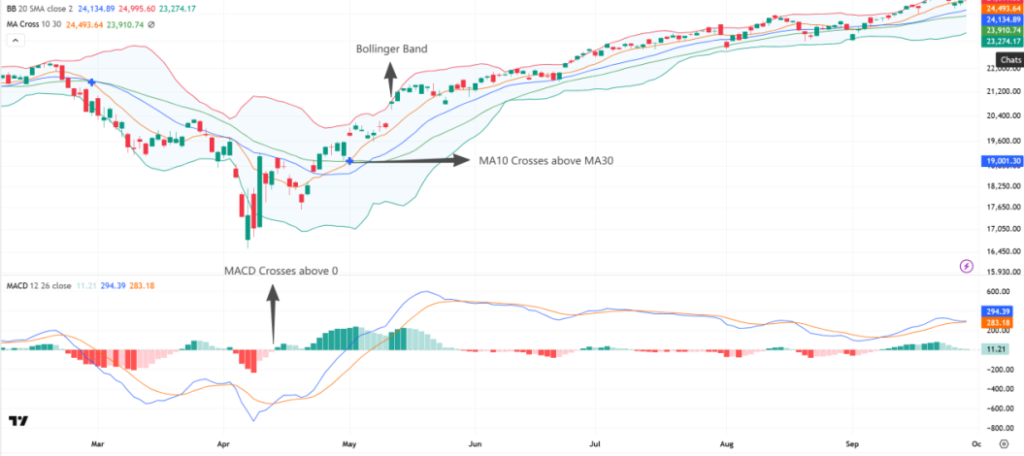
It is like pushing a car from the top of a hill. It will surely rush to the bottom at high speed, but you cannot point to the car’s engine casing and say, “Look, this casing is amazing! The car ran so fast because I cast a magical Chan Theory spell on it.” Even if you pushed a big rock instead of a car, it would also roll down to the bottom. You don’t need to know any special techniques for this. This is what it means to follow the trend.
But why do most people always focus on the casing? Because human nature craves certainty. Uncertainty makes us so uncomfortable that we always want a reason for every phenomenon. We feel uneasy when there is no explanation.
That’s why you hear absurd logic like “the car rolled down because the casing looked cool.” Many believe it because the casing is visible and tangible, while the real reason—gravity and the conversion of potential energy into kinetic energy—is invisible, intangible, and hard to grasp. People dislike what they cannot see, so they prefer to believe that a flashy casing makes the car go faster.
This is why you often hear ridiculous claims like:
- The stock market will go up when women’s skirts get shorter.
- The stock market will go up when Jupiter and Saturn are in line.
- The stock market will go up today if I wear green clothes.
Let me use math to make this more convincing. Take Bollinger Bands as an example. Bollinger Bands have three lines. The middle line is a 20-day moving average (MA20), and the upper and lower bands are created by adding and subtracting two standard deviations from the middle line. You don’t need to learn the formula or even worry about how to use it. That’s not the point here.
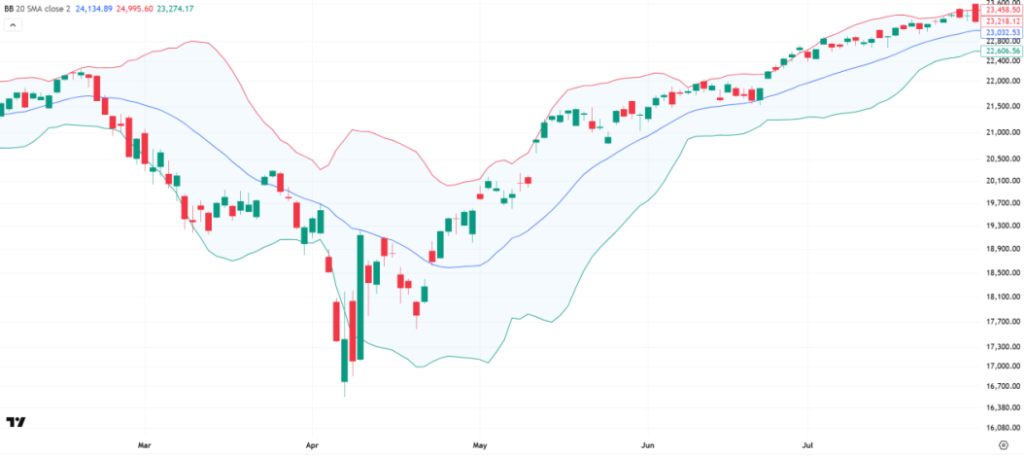
The main idea of Bollinger Bands is to use statistics to explain how volatility affects the price. If prices are normally distributed, there is a 95.45% chance that they will be between the upper and lower bands, which are two standard deviations above and below the average. When prices reach the upper band, it could mean that the market is at a peak and will go back down, but it might also mean that prices have broken out of the original distribution and will continue to rise. When prices hit the lower band, it could mean that the market is at a relative low and may bounce back, but it could also mean that the original distribution has broken and prices will keep falling.
This leads to two different approaches: mean-reversion traders short when the price hits the upper band and long when it hits the lower band, while breakout traders buy when the price hits the upper band and sell when it hits the lower band. So, who is correct? When the price hits the upper band, should you go long or short?
The answer is that the win rate remains approximately 50% regardless of the approach. You can buy or sell when the upper band breaks, or even buy when the price crosses the middle band instead of the upper band. It has the same result even if you don’t use Bollinger Bands at all and use moving averages, MACD, or any other technical indicators instead. These indicators don’t matter much.
When the R/R ratio is 1:1 and the win rate is about 50%, the expected return of a trading system is 50% × 1 – 50% × 1 = 0. In economics, this is called a state of equilibrium. If any technical indicator really did give a much higher win rate, people would find out about it quickly and use it a lot, which would lower returns and bring expected value back to 0. Some people would eventually give up on it, which would make a short-term profit window, and the win rate would oscillate around 50% in the long run.
I tested gold (XAUUSD) data from May 5, 2003, to October 30, 2024, which is a 21-year period with a large sample size that makes the statistics more reliable. I set both my stop-loss and take-profit at 200 points for every trade to make sure the R/R ratio was 1:1. The results on the H1 timeframe were:
- Breakout: Buy when the price goes above the upper band; sell when it goes below the lower band. Win rate: 49.67%.
- Mean reversion: Sell when the price goes above the upper band; buy when it goes below the lower band. Win rate: 50.33%.
- MACD: Buy when the MACD main line goes above zero, and sell when it goes below. Win rate: 50.00%.
- KAMA: Buy when fast KAMA is above slow KAMA, and sell when fast KAMA is below slow KAMA. Win rate: 49.72%.
- RSI (overbought/oversold): Buy when RSI < 30 and sell when RSI > 70. Win rate: 49.75%.
- RSI (trend-following): Short when RSI < 30, long when RSI > 70. Win rate: 50.25%.
You can see that the win rate stays around 50% no matter what the technical indicator does, as long as the R/R ratio is 1:1. There is no statistically significant difference between 49.75% and 50.25% for RSI. The slight edge of the latter could be because of how gold behaves in this dataset. I also assumed that there were no fees or commissions in my test. If you added transaction costs, no indicator would have a win rate higher than 50%.
You can now throw away books like “encyclopedias of technical indicators” that are sitting on your shelf. Do not blindly follow so-called masters. Though I respect William Delbert Gann’s contributions to trading, when I saw him devote pages to astrology and the stock market, I threw his book away.
Are technical indicators totally useless? No. The engine can’t run without a casing, but no matter how fancy the casing is, it doesn’t make the engine work better.
The main job of technical indicators is to track trends. (track, not predict—you can’t predict prices.) You need a signal to tell you that the trend has begun. This signal can take many forms. In a race, you can start at the sound of the starting gun or by watching the referee’s gesture. The important thing is that you have a cue to start running, not that you stand still while others have already begun.
There are many different ways to track trends, and all technical indicators are just different ways to do this. The 10-day moving average (MA10) is the average of the last 10 closing prices. When the MA10 crosses above the MA20, it means that prices are going up faster in the short term than in the long term, and a trend is starting to form. However, since moving averages are calculated from historical data, they always lag. How can a lag indicator predict prices? Absolutely not. By the time you see the crossover, prices have already moved.
You might think that since moving averages lag, it would be better to use a more sensitive indicator, but no indicator is perfect. Greater sensitivity lets you enter sooner, but it also creates more false signals, so most of the money you make by getting in early will be lost again.
What actually drives the car forward is the full structure of the engine, gears, and transmission. Likewise, a profitable trading system requires entry rules, exit rules, money management, and risk control working together.
I will talk about what parts a trading system needs in the next few chapters. Once I give you all the parts, you will be able to put it together and drive it on the road. You can trust me when I say that making a trading system isn’t difficult. Using AI makes it even easier because it can make one for you in seconds.
Summaries:
- Any technical indicator will make money when a trend comes. No matter what kind of car you drive, whether it’s a Lamborghini, or a toy car, they will all roll downhill.
- Technical indicators are not for predicting trends. They are for finding and following them.
- More sensitive technical indicators lead to more false signals and losses. Most of the money you make by getting in early will be lost again because of mistakes.
- You need a trading system with a set of rules. An engine is important, but it can’t drive by itself.
The Previous Article: The Myth of High Win Rate Trading Systems
The Next Article: The Myth of the Holy Grail in Trading