The conflict between the U.S. and Iran is escalating, with no sign of easing. Iran has once again proven to be a “tough nut” in the Middle East, far from easy to break.
Iran’s real weapons are not jets or tanks.
They are the economy, the Strait of Hormuz, energy, and inflation.
In recent months, U.S. unemployment has been trending higher. Without the war, gradual rate cuts from the Fed could have helped the economy toward a soft landing instead of a recession. But after the war flared up in late February, everything had changed.
As energy prices rise, inflation is coming back. Combined with a weakening job market, the market is increasingly worried about stagflation, the most painful phase of the economic cycle. “Stagflation” means high inflation, low growth, and high unemployment at the same time. If it happens, it will put even more pressure on an already fragile economy.
But this is not new. We have seen stagflation before.
In the 1970s, the U.S. went through two classic stagflation periods.
1. Stagflation in the 1970s
Normally, GDP and inflation move together. When the economy overheats, inflation rises. But in 1973–1974 and 1976–1980, the U.S. saw a clear split between growth and inflation. That is what stagflation looks like.
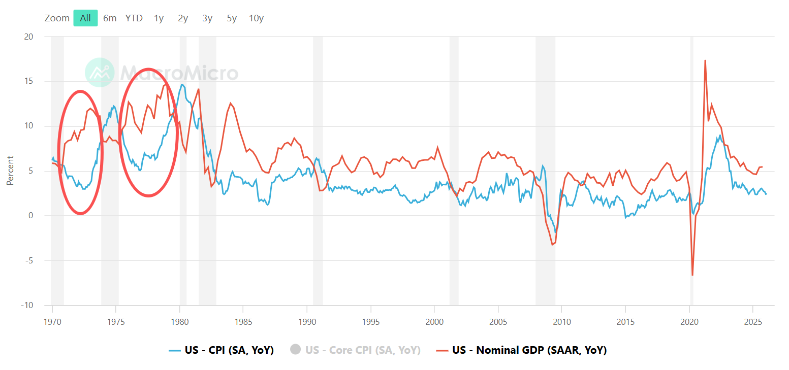
So what caused it?
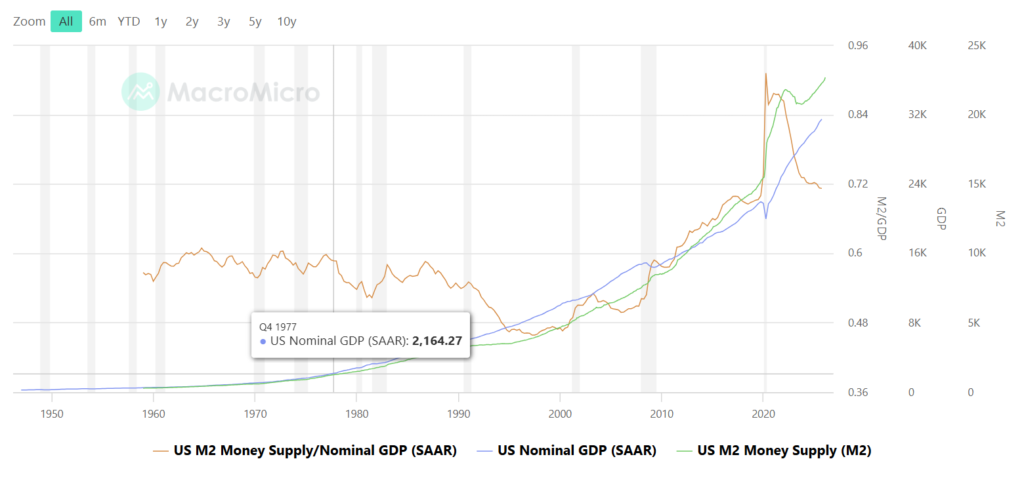
First, during that time, the money supply expanded rapidly, with M2/GDP staying high. The U.S. government ran large deficits for the Vietnam War. A more recent example is the massive money printing during the 2020 pandemic, which is still affecting inflation today.
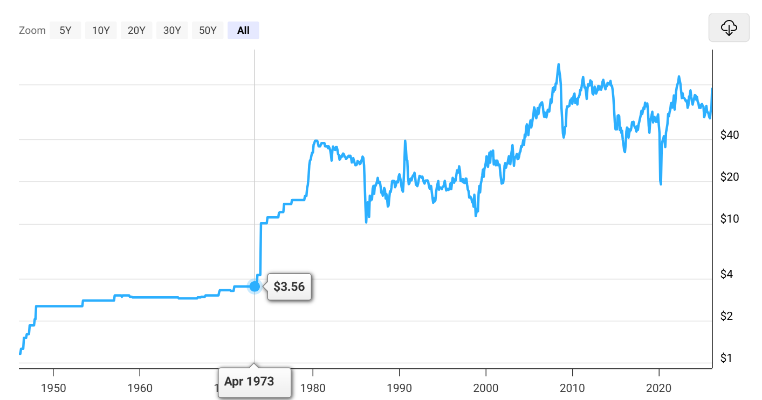
Second, the Yom Kippur War in 1973 changed everything. Before the war, WTI crude was about $3.56 per barrel. By mid-1980, it had surged to $39.50, more than a tenfold increase.
The similarities to today are striking.
After the pandemic, the world is still dealing with excess liquidity. The U.S. interest rates remain high at around 3.5%–3.75%. If inflation returns due to the U.S.–Iran war, the Fed may have very limited room to raise rates further.
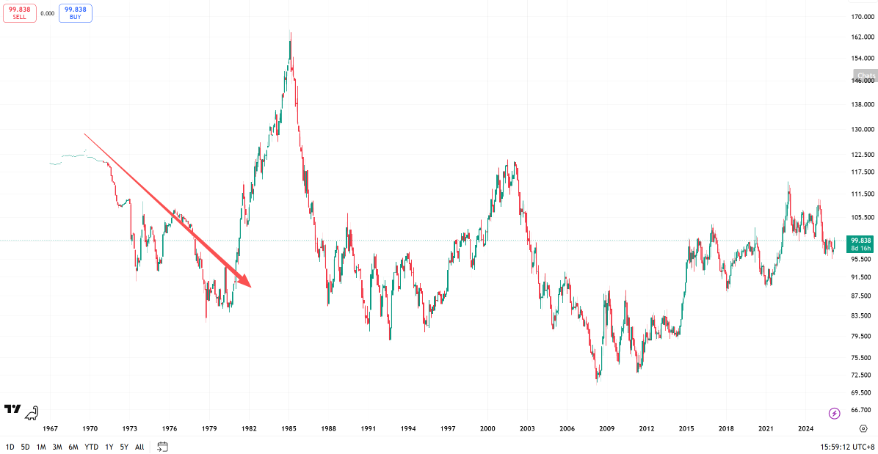
The key difference is that in 1973, the Bretton Woods system collapsed. At the same time, U.S. trade deficits were expanding and gold reserves were shrinking, leading to a sharp drop in the dollar and weakening global confidence in dollar assets. But this time, the crisis is strengthening the dollar.
2. Asset Performance During Stagflation
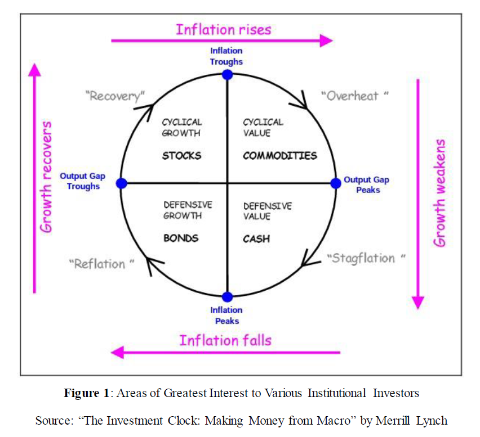
According to the Merrill Lynch investment clock, stagflation is a tough environment where few assets perform well, and holding cash is often the safest choice.
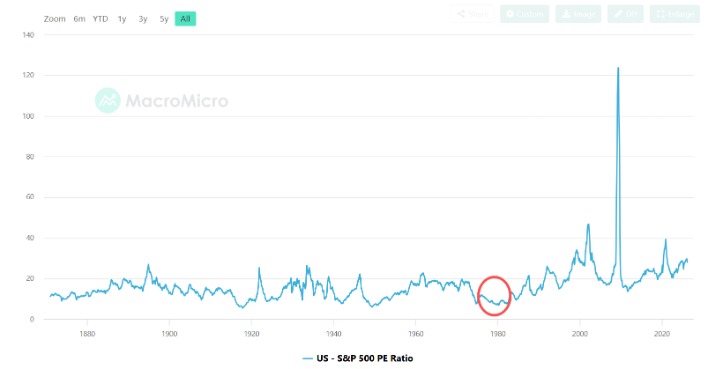
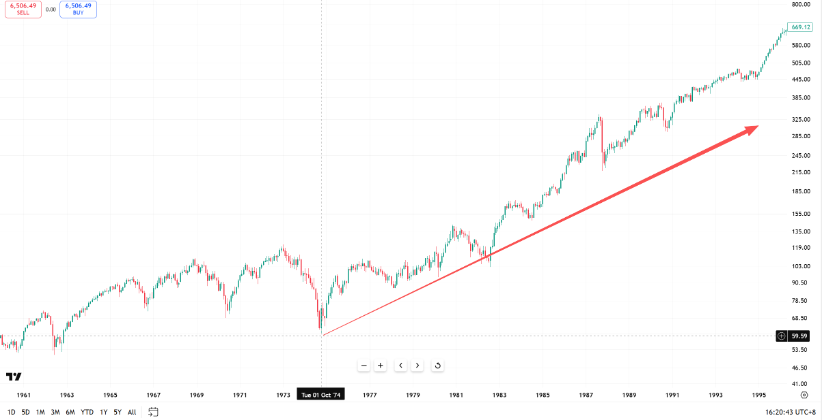
During the first stagflation period (1973–1974), the S&P 500 fell from 121.74 to 60.96, nearly a 50% drop. In the early 1970s, U.S. stocks had just gone through the “Nifty Fifty” boom with high valuations. As stagflation hit, tighter liquidity and negative sentiment pushed valuations down sharply, from around 20x PE to below 7x.
But once pessimism was fully priced in, the market found a bottom. As earnings gradually improved, stocks entered a long bull market.
During the second stagflation period (1976–1980), equities, driven by earnings growth and recovering confidence, performed well.
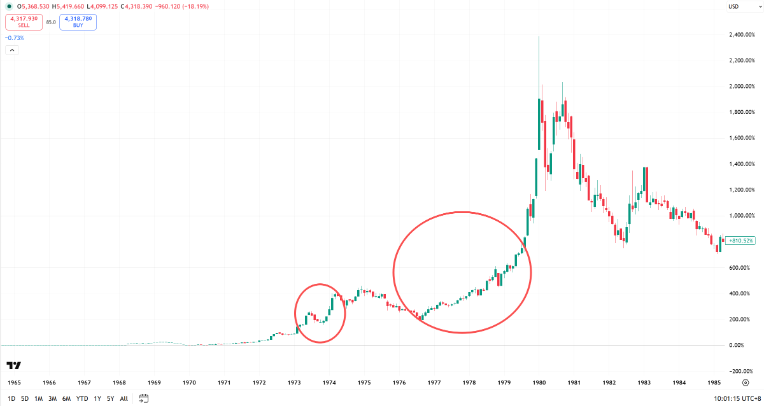
Gold also performed strongly during both stagflation periods, as commodities benefited from inflation. However, this time is different. Back then, gold price was supported by a weak dollar, but today, expectations of higher rates are keeping the dollar strong, pulling capital away from gold.
3. Lessons from History
Stagflation is not a disaster. It is just part of the economic cycle. When crises pass, recovery follows.
Even in stagflation, quality assets can survive. Price drops during this period are often driven by tighter liquidity, not by a collapse in fundamentals. In a downturn, companies built on hype tend to fade, while those with strong fundamentals stand out.
Energy was the best-performing sector during stagflation. During the oil crises, profits of oil companies surged, and the energy sector’s weight in the S&P 500 rose from 20% in 1970 to 30% by 1981.
Consumer sectors are not always defensive. Rising inflation increases costs, and discretionary spending tends to underperform.